
Financial statements are among the most powerful tools available to investors, business owners, and financial professionals. They reveal how a company earns money, how it spends it, how efficiently it operates, and how financially stable it is. Yet, despite their importance, many people find financial statements confusing, intimidating, or difficult to interpret.
The ability to read and understand financial statements is not just an accounting skill—it is a strategic advantage. Those who can interpret financial data effectively are better equipped to make informed investment decisions, identify strong businesses, avoid costly mistakes, and uncover opportunities that others may overlook.
This article provides a comprehensive guide on how to interpret financial statements and use them to make better financial and investment decisions. The focus is not on technical accounting theory, but on practical understanding and real-world application.
Why Financial Statements Matter for Investors and Decision-Makers
At their core, financial statements tell the story of a business in numbers.
Beyond Headlines and Market Sentiment
Stock prices, news headlines, and market trends often reflect short-term sentiment. Financial statements, on the other hand, provide insight into the underlying reality of a company’s performance and financial health.
Investors who rely solely on external opinions risk making emotional or poorly informed decisions. Those who analyse financial statements develop an independent perspective based on facts.
Turning Information into Opportunity
Markets are not always efficient. Companies with strong fundamentals may be undervalued, while weak businesses may appear attractive due to hype. Interpreting financial statements helps identify these gaps and turn information into potential profit.
The Three Core Financial Statements You Must Understand
Most financial analysis revolves around three primary financial statements.
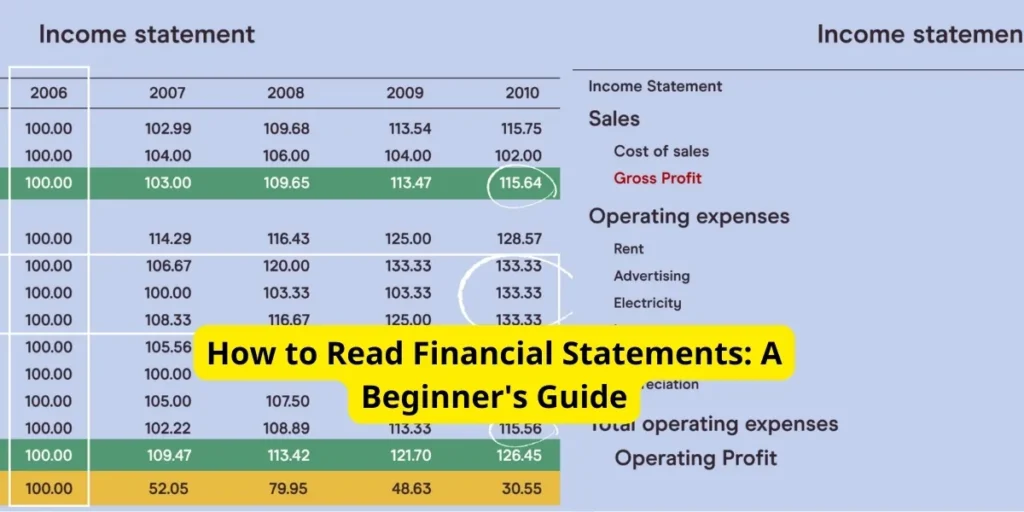
1. The Income Statement
The income statement shows a company’s financial performance over a specific period, such as a quarter or a year.
It answers the question:
Is the company profitable?
2. The Balance Sheet
The balance sheet provides a snapshot of a company’s financial position at a specific point in time.
It answers the question:
What does the company own and owe?
3. The Cash Flow Statement
The cash flow statement tracks the movement of cash in and out of the business.
It answers the question:
Is the company generating real cash?
Each statement serves a different purpose, and meaningful analysis requires understanding how they work together.
How to Interpret the Income Statement
The income statement reveals how revenue turns into profit.
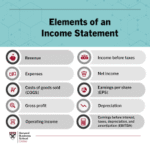
Understanding Revenue
Revenue represents the total income generated from selling goods or services.
Key questions to ask:
- Is revenue growing over time?
- Is growth consistent or volatile?
- Is growth driven by volume, pricing, or acquisitions?
Sustainable revenue growth is often a strong indicator of business quality.
Analysing Costs and Expenses
Expenses determine how much revenue turns into profit.
Common categories include:
- Cost of goods sold (COGS)
- Operating expenses
- Interest expenses
- Taxes
Rising expenses faster than revenue may signal inefficiency or margin pressure.
Profit Margins: The Real Measure of Performance
Margins show how much profit a company earns from each unit of revenue.
Important margins include:
- Gross margin
- Operating margin
- Net margin
Higher and stable margins often indicate pricing power, operational efficiency, or competitive advantages.
Identifying Earnings Quality
Not all profits are equal.
Look for:
- One-time gains or losses
- Accounting adjustments
- Unusual items
Consistent, repeatable earnings are more valuable than temporary boosts.
How to Interpret the Balance Sheet
The balance sheet shows what a company owns, owes, and retains.
Assets: What the Company Controls
Assets may include:
- Cash and equivalents
- Inventory
- Property and equipment
- Investments
- Intangible assets
Strong balance sheets typically have sufficient liquid assets and productive long-term assets.
Liabilities: What the Company Owes
Liabilities include:
- Short-term obligations
- Long-term debt
- Lease commitments
Excessive debt increases risk, especially in volatile or declining markets.
Equity: The Shareholders’ Stake
Equity represents the residual value after liabilities are subtracted from assets.
Key considerations:
- Is equity growing over time?
- Is growth driven by profits or external financing?
Healthy equity growth often reflects sustainable profitability.
Balance Sheet Strength and Financial Stability
A strong balance sheet provides:
- Resilience during downturns
- Flexibility for growth
- Lower financial risk
Weak balance sheets magnify the impact of economic stress.
How to Interpret the Cash Flow Statement
Profit does not always equal cash. The cash flow statement bridges that gap.
Operating Cash Flow
Operating cash flow shows how much cash the business generates from core operations.
Strong operating cash flow:
- Confirms earnings quality
- Supports reinvestment and dividends
- Reduces reliance on debt
Investing Cash Flow
This section reflects:
- Capital expenditures
- Acquisitions
- Asset sales
High investment spending is not necessarily bad if it supports future growth.
Financing Cash Flow
Financing cash flow includes:
- Debt issuance or repayment
- Share issuance or buybacks
- Dividends
This section reveals how the company funds operations and rewards shareholders.
Connecting the Three Statements
The real insight comes from analysing how the statements interact.
Profit vs Cash Flow
A company may report profits while struggling to generate cash. This may signal:
- Aggressive accounting
- Rising receivables
- Inventory issues
Cash flow often provides a clearer picture of financial health.
Growth vs Balance Sheet Impact
Rapid growth can strain balance sheets through:
- Increased debt
- Higher working capital needs
Sustainable growth balances expansion with financial stability.
Key Financial Ratios for Smarter Analysis
Ratios simplify complex data and allow comparison across companies.
Profitability Ratios
- Return on equity (ROE)
- Return on assets (ROA)
These ratios measure how effectively a company uses capital to generate profit.
Liquidity Ratios
- Current ratio
- Quick ratio
Liquidity ratios assess the company’s ability to meet short-term obligations.
Leverage Ratios
- Debt-to-equity
- Interest coverage
Leverage ratios highlight financial risk and debt sustainability.
Efficiency Ratios
- Inventory turnover
- Receivables turnover
Efficiency ratios reveal how well a company manages resources.
Identifying Red Flags in Financial Statements
Strong analysis involves recognising warning signs.
Common Red Flags
- Declining margins
- Rising debt with falling profits
- Weak operating cash flow
- Frequent accounting changes
- Heavy reliance on one-time gains
Red flags do not automatically mean failure, but they require deeper investigation.
How Investors Can Profit from Financial Statement Analysis
Understanding financial statements creates opportunity.
Identifying Undervalued Companies
Markets may undervalue companies with:
- Strong cash flow
- Improving margins
- Conservative balance sheets
Investors who recognise these qualities early may benefit over time.
Avoiding Overvalued or Risky Investments
Financial statements help investors avoid:
- Companies with unsustainable debt
- Businesses with deteriorating fundamentals
- Profits driven by accounting rather than operations
Avoiding losses is just as important as finding winners.
Long-Term vs Short-Term Strategies
Long-term investors focus on:
- Sustainable earnings
- Strong balance sheets
- Competitive advantages
Short-term traders may still use financial data to assess risk and volatility.
Financial Statements for Business Owners and Entrepreneurs
Financial statements are not only for investors.
Improving Business Decisions
Owners use financial statements to:
- Control costs
- Improve profitability
- Plan growth
- Manage cash flow
Clear understanding leads to better strategic decisions.
Measuring Performance Objectively
Financial statements provide an objective view of performance beyond intuition or optimism.
The Role of Industry Context
Financial data must be interpreted within context.
Comparing Like with Like
Different industries have different norms for:
- Margins
- Capital intensity
- Debt levels
Comparisons are most meaningful within the same industry.
Understanding Business Models
A company’s financial structure reflects its business model. Understanding how money is made improves interpretation.
Common Mistakes When Analysing Financial Statements
Even experienced readers make errors.
Frequent Mistakes
- Focusing on a single metric
- Ignoring cash flow
- Overlooking balance sheet risk
- Failing to consider trends over time
Holistic analysis reduces these risks.
Building a Simple, Repeatable Analysis Process
Consistency improves accuracy.
A Practical Framework
- Review revenue and profit trends
- Assess margins and cost structure
- Examine balance sheet strength
- Analyse cash flow quality
- Compare with industry peers
This process can be applied to almost any company.
Long-Term Thinking and Financial Statement Analysis
Financial statements are most powerful when used with patience.
Avoiding Short-Term Noise
Quarterly fluctuations matter less than long-term trends.
Compounding Advantage
Consistently choosing financially strong businesses can compound returns over time.
Education and Continuous Improvement
Financial analysis is a skill that improves with practice.
Learning from Past Decisions
Reviewing previous analyses and outcomes helps refine judgement.
Staying Informed
Accounting standards and business models evolve. Continuous learning maintains relevance.
Final Thoughts: Turning Financial Statements into Profitable Insight
Financial statements are not just accounting documents—they are tools for understanding reality. Those who learn to interpret them effectively gain clarity, confidence, and independence in financial decision-making.
Profiting from financial statements does not require predicting markets or discovering secret formulas. It requires:
- Discipline
- Critical thinking
- Contextual understanding
- Long-term perspective
By focusing on fundamentals rather than speculation, investors and business owners can reduce risk, identify quality opportunities, and make more informed decisions. In a world full of noise, financial statements remain one of the most reliable sources of truth.
Mastering them is not just an advantage—it is a foundation for sustainable financial success.
Summary:
Peter Leeds, one of North America’s leading Investment Coaches, is a self-made millionaire who has created his fortunes on the stock markets. He has also empowered thousands of individuals to do the same. He offers sites like http://www.pennystockinsider.com to help penny stock investors make wise decisions.
Keywords:
penny stock investing smallcap microcap
Article Body:
Financial statements are a useful tool for judging the health of a company, and for comparing it to its competitors. They show what the company owes and owns, the profits or loses it has made over a given period, and how their position has changed since their last statement. Generally if you can tell which direction a company is heading in, you can also forecast future stock prices with some accuracy.
Gaining a basic knowledge of financial statements, and applying this knowledge when choosing or assessing investments can help you pick tomorrow’s winning stocks, while avoiding tomorrow’s losers.
Of course, financial statement analysis will not always factor in significant news events, unexpected incidents, changes in management, and other factors which may influence share prices, but it provides a starting point from which to gauge the present value of shares, independent of future occurrences.
The following report details some simple financial statement explanation and analysis methods. Although the topic can get much deeper and more complex, this article is designed to give investors the ability to understand the numbers and simpler of financial ratios, and be able to use that knowledge to assist them to make better decisions when doing their due diligence.
Balance Sheet
The balance sheet shows a company’s financial position at a specific date, usually the last day of the company’s fiscal year for annual reports. One side of the balance sheet shows what the company owns and has owing to it, called assets. The other side represents liabilities, which are what the company owes, and also has shareholders’ equity, which represents the excess of the company’s assets over its liabilities. Shareholder’s equity is often referred to as book value.
Total assets are equal to the sum of the company’s liabilities plus the shareholders’ equity. In other words, take away liabilities from assets and the remainder is what value is owned by the shareholders.
The Balance Sheet can be used to uncover the value of the company, the debt load, and cash position.
Earnings Statement
Also called the Income Statement or Profit and Loss Statement, it shows how much revenue a company received during the year from the sale of its products and services, and the expenses the company incurred due to wages, taxes, operating costs, etc… The difference between the two is the company’s profit or loss for the year. The amount left over after taxes is the net earnings.
Net earnings are basically saying how much money the company �really’ made over the course of the year. Some companies can have low earnings if they used much of their money for research and development, to acquire other companies, fuel aggressive growth, move into new markets, etc, which is much more favorable than if the company had low earnings because they didn’t generate many revenues, their expenses were too high, etc…
Statements of Changes in Financial Position
This shows how the company’s financial position changed from one year to the next. Also called the cash flow statement, this details how the company generated and spent its cash during the year.
This statement can be used in evaluating the liquidity and solvency of a company, and to assess the ability of that company to generate cash internally, to repay debts, to reinvest in itself, etc…
Sources of Financial Reports
Certainly you can get financials from the companies themselves. Most will gladly fax them to you, or mail you their latest quarterly and annual reports.
However, a faster way to access the information can be by Internet. For example, go to Yahoo.com and choose stock quotes. Enter the ticker symbol for the company you are interested in, and Yahoo will provide its most recent press releases, which will include past quarterly and annual reports with the financial statements. You can also check the previous reports to compare which direction the company is moving in and look for trends (i.e. increasing debt load, unpredictable earnings, decreasing revenues, erratic revenues, etc…).
There are also many other Internet resources which provide similar information, such as wsrn.com, bigcharts.com, (canada-stockwatch.com for Canadian issues), etc…
Comparison Shopping
To familiarize yourself with some of the numbers, try looking up the financials of three companies you own or are interested in.
(Balance Sheet) Which of the companies has the greatest long term debt load? Do any of the companies have greater current liabilities than current assets? Compare the current share price to the shareholder’s equity (book value): is the share price much greater or less than the book value?
(Earnings Statement) What were the revenues of the most recent year (or quarter) and does the number represent an increase or decrease from the previous period? How much money per share did the company earn (or lose) in the most recent period?
(Statement of Changes in Financial Position) Has company debt been increasing or decreasing? What was the greatest expense the company incurred according to the statement?
Decision Making
Understand that financial statements can provide investors with a partial fundamental snapshot of a company. They only represent one piece of the puzzle. Remember that, while financial statements can help investors compare several companies, comparison is limited only to the numbers provided.
In other words, you can see that one company made money while the other lost money, but you don’t know which has the better technical outlook (based on analysis of the trading chart), which is a potential takeover target, which will have the best future earnings, etc…
As well, the impact of financial statements tends to be long-term as it relates to share prices. Four quarterly reports showing increasing earnings may push the stock into an upward trend as the market begins to recognize the fundamental improvements of the underlying company, but one quarter of increasing earnings may or may not have a significant impact on shares.
Therefore, most investors use financial statements as part of a greater overall decision making process. Certainly, though, an understanding of and familiarization with the data can benefit any investor who takes the time to make educated trading decisions.
Important Points
Many growth companies don’t need nor are expected to have positive earnings. Instead, they generally accumulate debt as they focus on research and development of new technologies, aggressively move into new markets, fight for market share with competitors, etc… Other companies with minimal growth prospects on the other hand, have more importance placed on actual earnings, lowering operational costs, etc…
Be sure to understand what numbers are important and unimportant to a specific company based on their situation and the position they are in. This can be done easily by going to wsrn.com and doing an industry comparison on the company in question. Do companies in the same industry seem to have positive earnings, or is the focus on growth, research, etc… Are they a larger or smaller company than the industry average, and are they growing faster than the others?
Read the fine print to make sure the numbers you are reading have been audited, rather than being just company estimates, or unverified results. This generally is not something you need to worry about with most exchange-listed companies, but it is important practice.
Many annual statements will begin with positive news about sales or revenue increases, or other positive comments, but further reading reveals that the company actually lost more money, increased debt, or had a poor quarter or year. For most companies their financial statements are part of their promotional material and they need to make the information sound as impressive and positive as possible, even if the overall results were disappointing.
Be wary of one-time earnings or loses. For example, a company may win a huge lawsuit settlement and the influx of money gives them positive earnings for the quarter. However, how would they have done when the one-time extraordinary is ignored? Learn more at http://www.pennystockinsider.com.


Tinggalkan Balasan